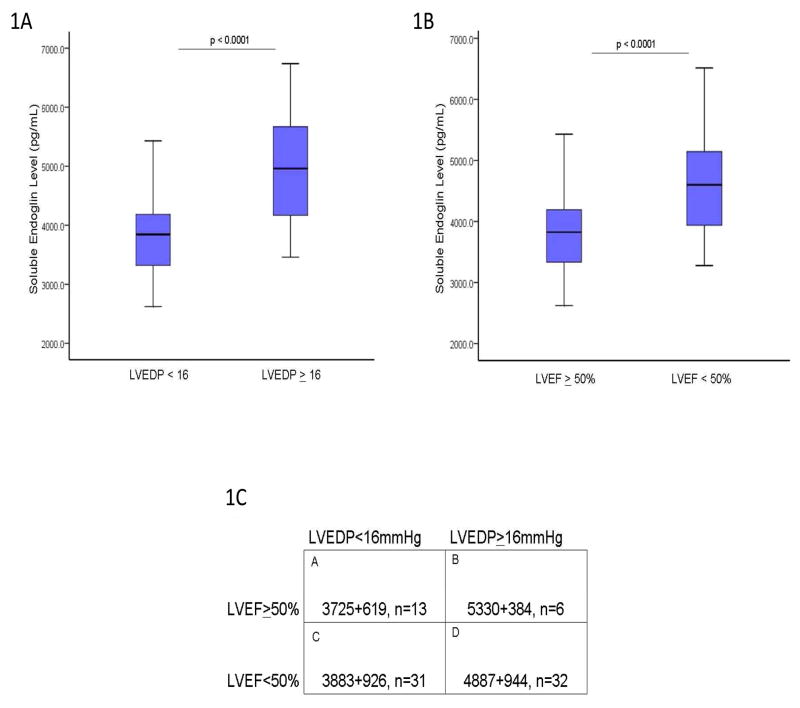
Figure 1.
Soluble Endoglin Expression and LV Filling Pressure. 1A) When grouped by LVEDP, sEng levels are significantly higher in patients with an elevated LVEDP>16 compared to a low LVEDP<16 (4912+922 vs 3785+724 pg/mL, respectively, p<0.0001). 1B) When grouped by LVEF, subjects with low LVEF<50% had significantly increased sEng levels compared to controls (4620+980 vs 3590+588, p<0.001, respectively) or subjects with LVEF>50% (4620+980 vs 3650+550, p<0.001, respectively). 1C) When grouped by both LVEF and LVEDP, sEng levels were significantly increased in subjects with an elevated LVEDP irrespective of LVEF (Group A vs B or D, p<0.001; Group A vs C, p=NS; Group C vs B or D, p<0.001; Group B vs D = NS). [LVEDP: left ventricular end-diastolic pressure; LVEF: left ventricular ejection fraction; sEng: soluble endoglin]

