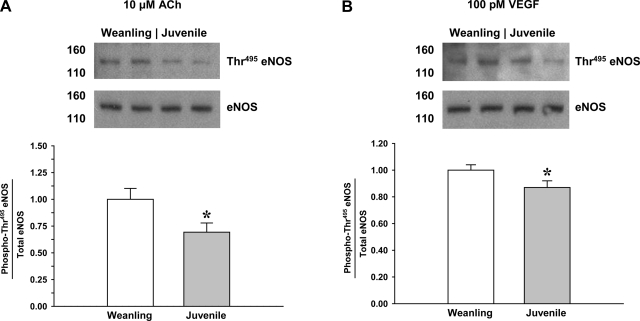
Fig. 4.
Phosphorylation of eNOS at Thr495 in arterioles from weanling and juvenile rats after exposure to 10−5 M ACh (n = 6 samples/group; A) or 10−10 M VEGF (n = 5 samples/group; B). Representative blots show differences between age groups in the relative abundance of phospho-eNOS after agonist exposure. Data are expressed as the ratio of phospho-eNOS to total eNOS. *P < 0.05 vs. weanling values.

