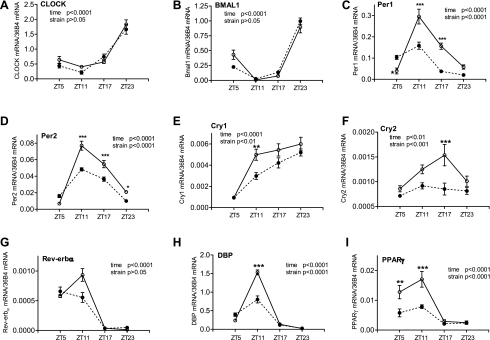
Fig. 2.
Daily mRNA expression profiles of clock and target genes in mesentery arteries isolated from diabetic db/db mice and control mice. Male 9- to 10-wk-old db/db mice (● and dotted lines) and control mice (○ and solid lines) were euthanized at ZT5, ZT11, ZT17, and ZT23. Mesenteric artery beds were harvested and cleaned free of fat, and mRNAs were quantified using real-time PCR. A: CLOCK. B: BMAL1. C: Per1. D: Per2. E: Cry1. F: Cry2. G: Rev-erb-α. H: DBP. I: PPAR-γ. n = 5 for each mouse strain at each time point. *P < 0.05, **P < 0.01, and ***P < 0.001 when compared between db/db mice and control mice at the same time point in the post hoc analysis.

