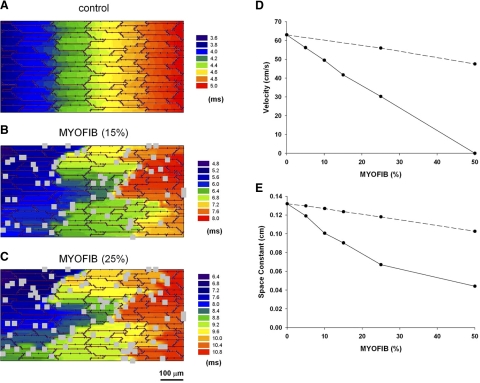
Fig. 10.
Effect of myofibroblast proliferation on conduction velocity when myofibroblasts displace myocytes. Activation maps during longitudinal propagation (from left to right) in the absence of myofibroblasts (A), for a density of 15% (B) and for a density of 25% (C) for a basic cycle length of 250 ms. D: longitudinal conduction velocity for different densities of myofibroblasts when myofibroblasts displace myocytes (solid line) and when myocytes are located on top of myocytes (dashed line). E: space constant in the longitudinal direction for different densities of myofibroblasts when myofibroblasts displace myocytes (solid line) and when myocytes are located on top of myocytes (dashed line).

