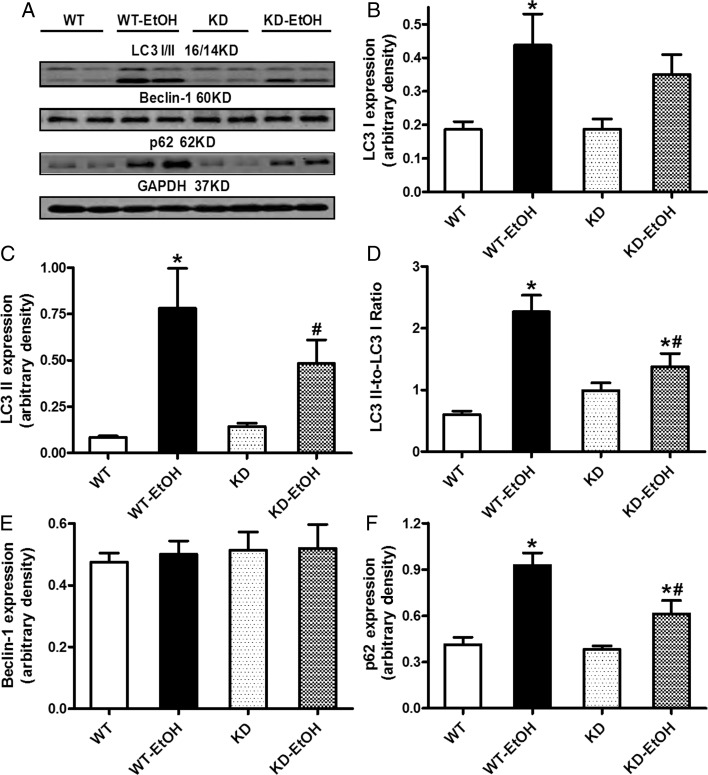
Figure 2.
Expression of autophagic markers in hearts from WT and KD mice with or without acute ethanol challenge (3 g/kg, ip for 3 days). (A) Representative gel blots depicting LC3 I, LC3 II, p62, Beclin-2, and GAPDH (loading control) using specific antibodies; (B) LC3 I expression; (C) LC3 II expression; (D) LC3 II-to-LC3 I ratio; (E) Beclin-1 expression; and (F) p62 expression. Mean ± SEM, n = 7–10 mice per group, *P < 0.05 vs. WT group, #P < 0.05 vs. WT-EtOH group.

