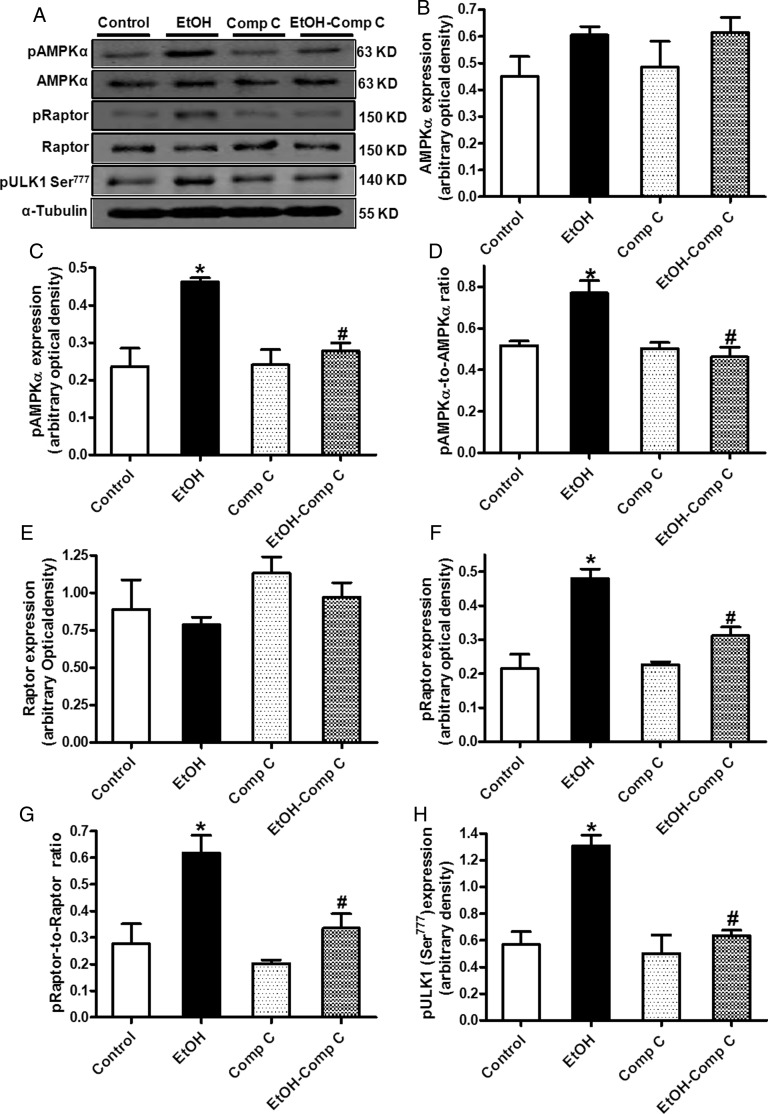
Figure 4.
The effect of compound C (5 µM) on AMPK-mTORC1-ULK1 signalling in the absence or presence of ethanol exposure (240 mg/dL, 4 h) in H9c2 cells. (A) Representative gel blots depicting pan and phosphorylated AMPK, Raptor, ULK1, and α-tubulin (loading control) using specific antibodies; (B) AMPKα; (C) phospho-AMPKα (pAMPK, Thr172); (D) pAMPKα-to-AMPKα ratio; (E) pan Raptor; (F) phospho-Raptor (pRaptor, Ser792); (G) pRaptor-to-Raptor ratio; and (H) pULK1 (Ser777). Mean ± SEM, n = 5–6 mice per group, *P < 0.05 vs. WT group, #P < 0.05 vs. WT-EtOH group.

