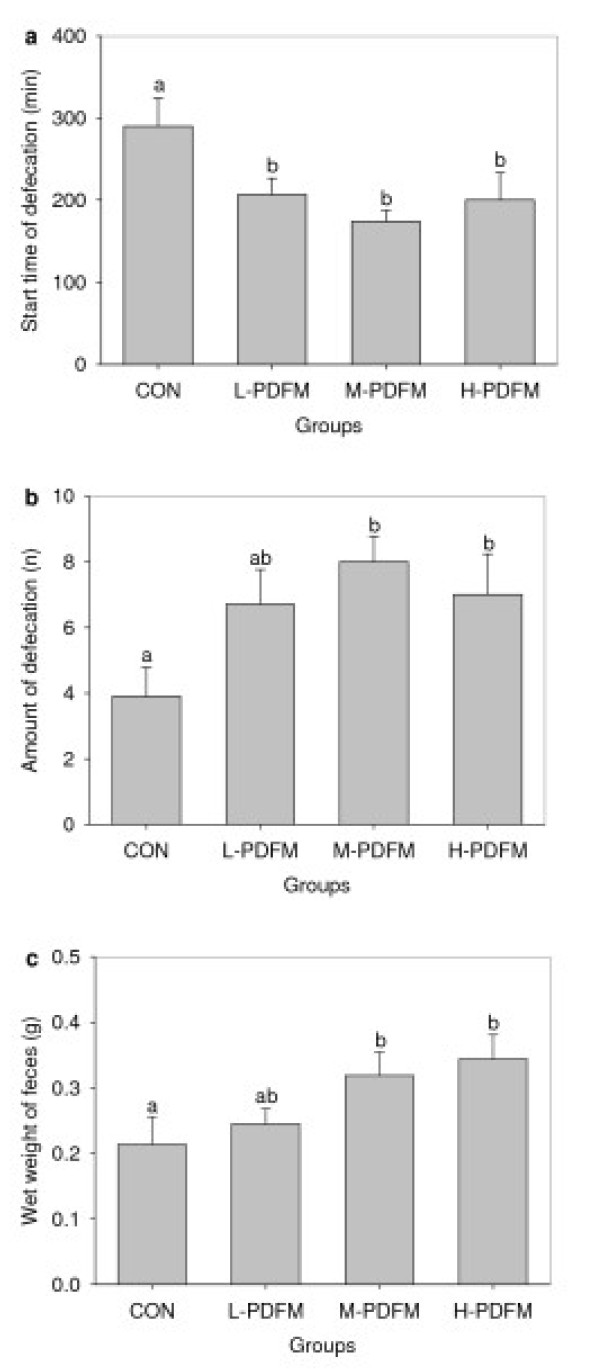
Figure 1.
Effect of PDFM on fecal output character in normal mice. CON: the control group; L-, M- and H- PDFM: L-, M- and H- PDFM groups. Bars represent the mean ± SEM. n = 10. Groups sharing different letters above the bars mean statistically significant differences (P < 0.05), while those denoted by any same letters are insignificantly.

