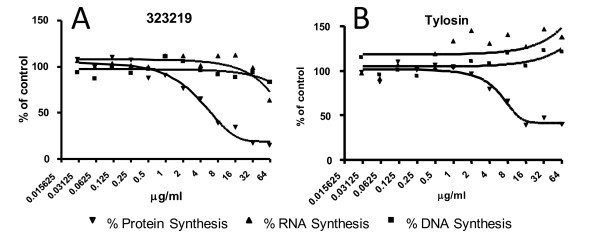
Figure 7.

An MMS assay showing inhibition of DNA, RNA, and protein synthesis in E. coli tolC cultures. MMS assays in which (A) 323219 and (B) tylosin were titrated into the assays. In these assays, the IC50 for 323219 and tylosin were calculated to be 6.2 and 11.6 μg/ml, respectively. Black triangle represents the percent of RNA synthesis, black square represents the percent of DNA synthesis, and black inverted triangle represents the percent of protein synthesis inhibited.
