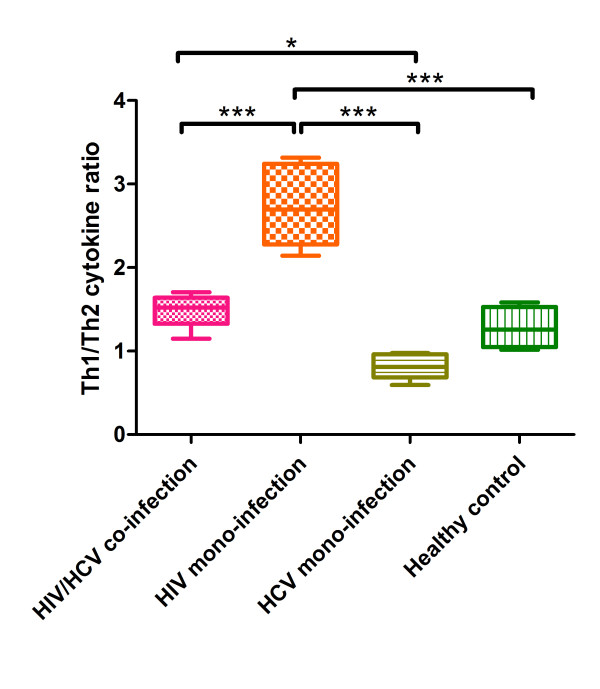
Figure 4.
Ratio of Th1 and Th2 cumulative concentration at baseline in different groups. Horizontal axis represents four different study groups: HIV/HCV co-infection group (pink rectangle), HIV mono-infection group (orange rectangle), HCV mono-infection group (olive rectangle), and healthy control (green rectangle); vertical axis represents the ratio of Th1 and Th2 cytokine cumulative concentration at baseline. *: p < 0.05; ***: p < 0.001.

