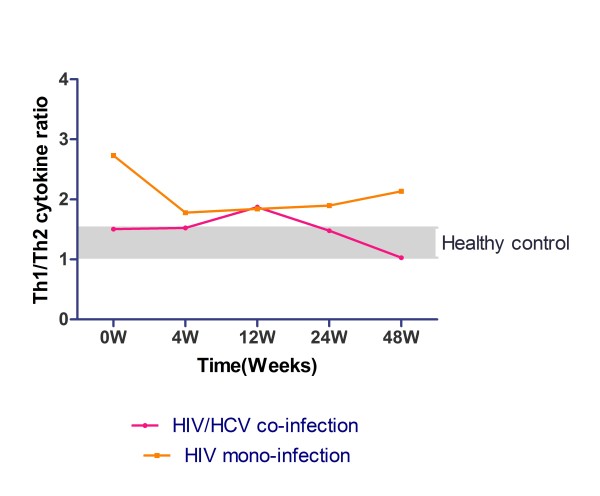
Figure 6.
Comparison of the dynamic change of Th1/Th2 cytokine ratio during HAART between HIV/HCV co-infection group and HIV mono-infection group. Vertical axis represents the ratio of Th1 and Th2 cytokine cumulative concentration at baseline; two coloured lines represent different study group: HIV/HCV co-infection group (pink line), HIV mono-infection group (orange line). Gray zone was shown as the Th1/Th2 ratio range of healthy control.

