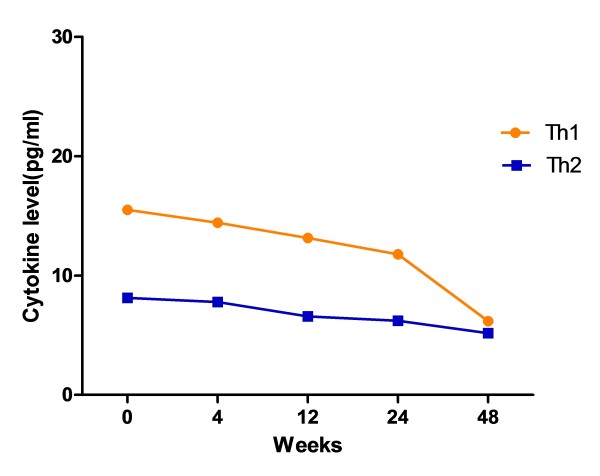
Figure 7.
Changes of Th1 and Th2 cytokine expression levels during HAART in both HIV mono-infection and HIV/HCV co-infection group. Vertical axis represents cytokine concentration (pg/ml) in plasma. The orange line represents Th1 cytokine cumulative concentration (pg/ml); the blue line represents Th2 cytokine cumulative concentration (pg/ml).

