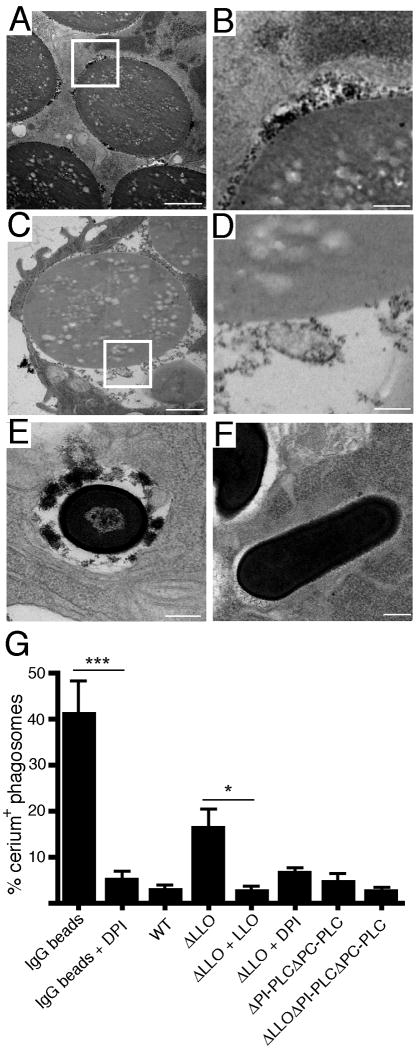
Figure 2. LLO inhibits ROS production in phagosomes.
(A, B) Phagosomal production of ROS was assessed via transmission electron microscopy (TEM). RAW 264.7 macrophages were treated with IgG-coated latex beads in the presence of cerium chloride. Reduction of cerium chloride results in the formation of cerium perhydroxide precipitate. The presence of these electron-dense products in TEM was indicative of NOX2 NADPH oxidase production of ROS. (B) is a higher magnification view of the boxed region in (A). (C, D) Experiment conducted as in (A) and (B) but in the presence of DPI. (D) is a higher magnification view of the boxed region in (C). RAW 264.7 macrophages were infected with either WT or ΔLLO bacteria at MOI 10. (E) Representative TEM of a ΔLLO-containing phagosome at 60 min p.i.. (F) Representative TEM of a wild type-containing phagosome at 60 min p.i.. (G) The percentage of cerium perhydroxide+ phagosomes at 60 min p.i. were quantified. One hundred phagosomes were assessed per sample from four independent experiments. Bars represent mean ± SEM. All scale bars are 1 μm.

