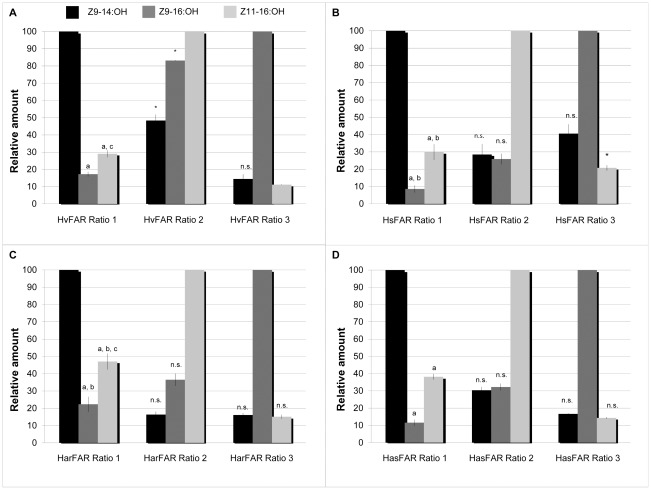
Figure 5. Multi-substrate assays of the four heliothine pgFARs.
The graphs represent (A) the produced amounts of Z9–14:OH, Z9–16:OH, and Z11–16:OH, illustrated as relative amounts from the functional assays of HvFAR, (B) HsFAR, (C), HarFAR and HasFAR (D). Bars represent the standard error of the mean. These results show that the heliothine pgFARs are broad range enzymes with a substrate preference for Z9–14:acyls followed by Z11–16 and then Z9–16 acyls, and that there is a trend for all pgFARs that the most abundant precursor will be converted to the major product in vitro. The used precursor ratios are referred to in Table 1. The marking a equals P<5% to Z9–14:OH, b P<5% between HsFAR–HarFAR, c P<5% HvFAR–HarFAR, and * equals a significant difference of the marked bar to all other FARs. Non–significant results are marked with n.s.

