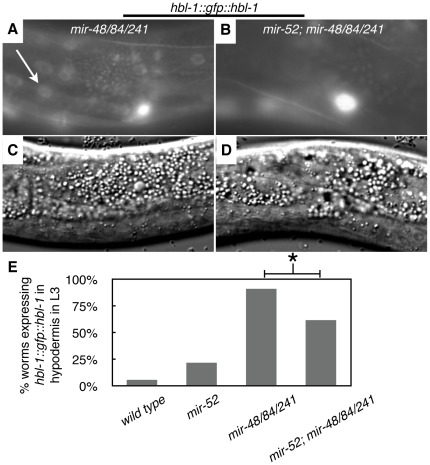
Figure 1. Loss of mir-52 .
suppresses hbl-1 misregulation in mir-48/84/241 mutants. Representative fluorescent micrographs of hbl-1::gfp::hbl-1 transgene expression in (A) mir-48/84/241 and (B) mir-52; mir-48/84/241 mutant worms in the L3 stage with corresponding DIC images (C and D, respectively). White arrow in A indicates a hyp7 nucleus. (E) Percentage of worms with hbl-1::gfp::hbl-1 expression in hypodermis of L3 stage worms, n≥33 (range 33–37). * indicates significant difference (χ2, p<0.01).

