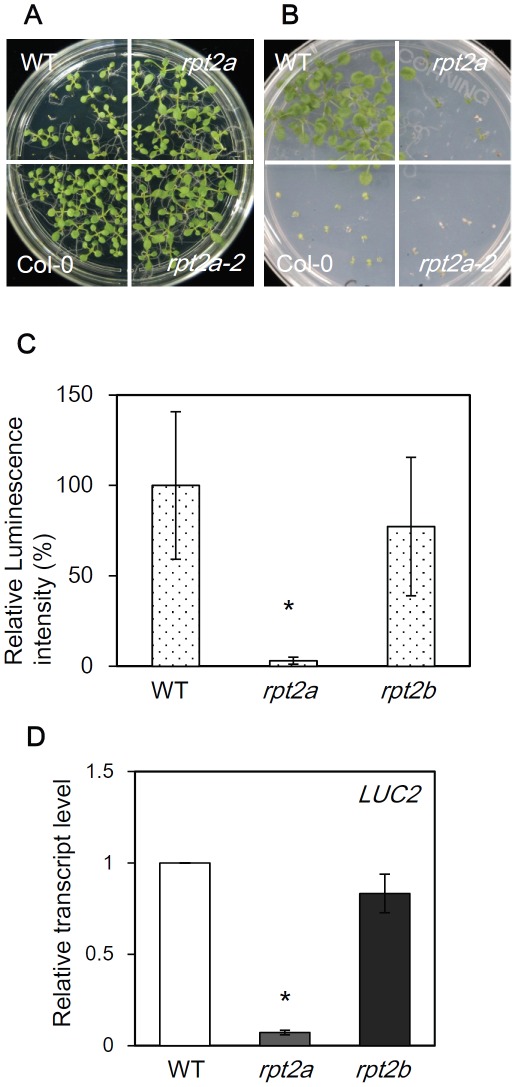
Figure 1. The rpt2a mutant shows transcriptional gene silencing.
(A) 35S::HPT in the Col-0 (WT) and rpt2a-2 mutant on MS medium. Col-0 plants without any transgene indicate “Col-0”. (B) 35S::HPT in the WT and rpt2a-2 mutant on MS medium containing 50 µM hygromycin. (C) Relative luminescence intensity of 35S::LUC2 in WT, rpt2a-2 and rpt2b-1 mutants. 35S::LUC2 in WT is set as 100%. *t-test P<0.05, error bar = S.D., n = 20. (D) Quantification of LUC2 gene expression in 35S::LUC2 in WT, rpt2a-2 and rpt2b-1 mutants. 35S::LUC2 in WT is set as 1. Values are the averages of the three experiments, and the level of 18S rRNA was used as an internal control.

