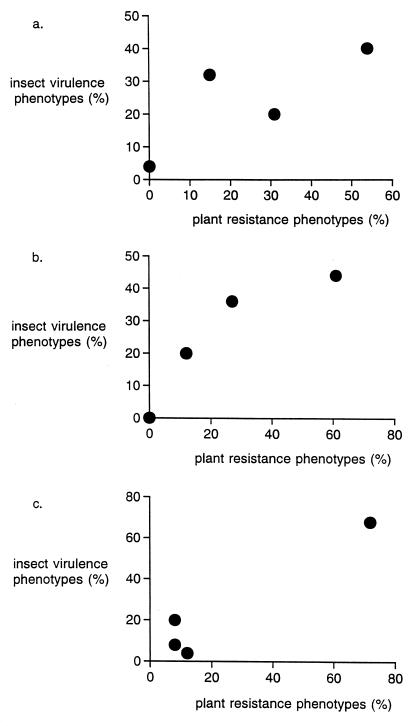
Figure 1.
Correlation between plant and insect phenotype frequency distributions for insect metabolism of furanocoumarins (horizontal axes) versus plant production of furanocoumarin compounds (vertical axes). Data obtained correspond to figure 4 of ref. 4: (a) Charleston, IL samples, (b) Winoma, MN samples, and (c) Peotone, IL samples.

