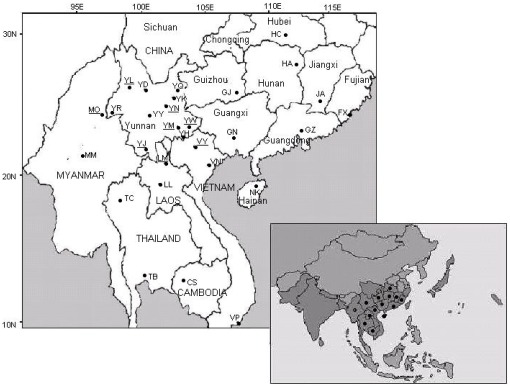
Figure 1. Sampling sites of B. dorsalis, coded according to Table 1 .
Sites that are underlined correspond to samples for which only mtDNA was studied. The map in the lower right corner is the known distribution range of B. dorsalis in Asia (in dark grey), and • represents the countries and provinces where we sampled B. dorsalis during the present study.

