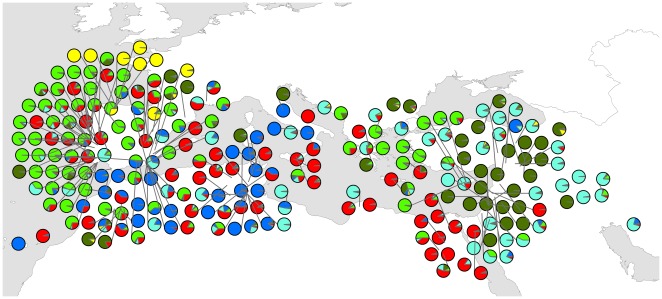
Figure 3. Geographical distribution of tetraploid wheat clusters.
Cluster membership was determined using STRUCTURE assuming six clusters (K = 6). Each accession is depicted as a pie chart with the proportional membership of its alleles to each one of the six groups: group Ia (dark green), group Ib (yellow), group IIa (light green), group IIb (red), group IIc (light blue) and group IId (dark blue).

