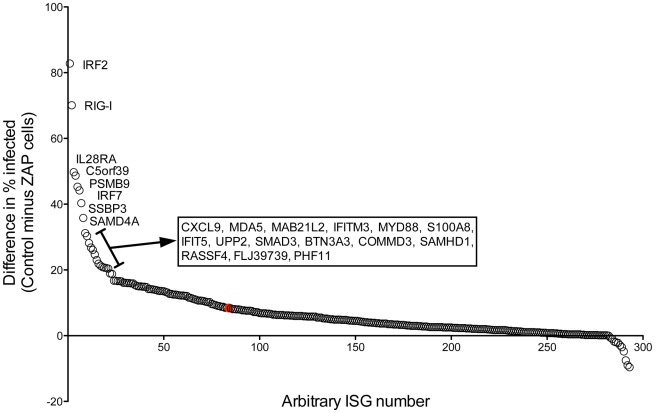
Figure 3. Reduction in the percentage of infected cells by ZAP.
For each ISG the reduction in the percentage of infected cells due to ZAP co-expression was calculated by subtracting the percentage of infected cells in the ZAP cells from the percentage infected in the control cells. After sorting, the differences were plotted versus an arbitrary ISG number. The difference seen between the control and ZAP cells in the absence of ISG expression (Fluc) is shown by the red symbol. Gene symbols are shown for the 23 ISGs with the greatest difference in infection percentage (≥18) due to ZAP expression.

