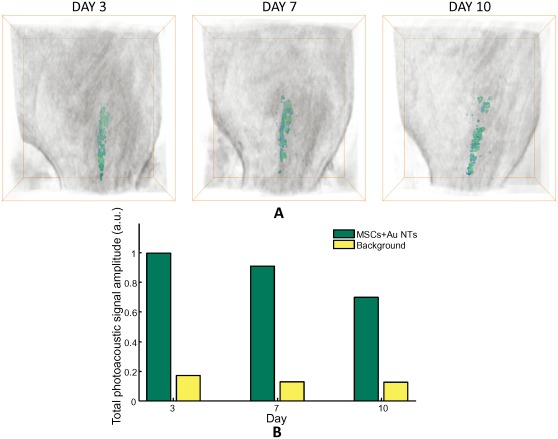
Figure 6. Longitudinal in vivo monitoring spatial distribution of MSCs labeled with Au NTs using US/PS imaging.
(A) 3-D combined ultrasound and spectroscopic images of the rat hind limb in which the PEGylated fibrin gel containing Au NT labeled MSCs were injected (day 3,7, and 10). The MSCs labeled with Au NTs were distinguished using spectral analysis and presented in green color. The bounding box for each image measures 23 mm laterally, 12.5 mm axially, and 25 mm elevationally. (B) The quantitative analysis of photoacoustic signal. The photoacoustic signals at three different time points obtained from the Au NT labeled MSCs and the background tissue were summed and displayed in green and yellow colors, respectively.

