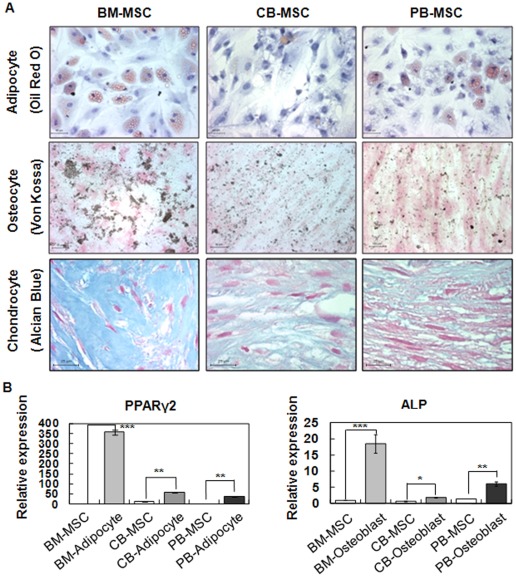
Figure 2. Differentiation potential of MSCs isolated from BM, CB and PB (in vitro differentiation of MSC cultures).
(A) Adipogenesis of BM-MSCs, CB-MSCs, and PB-MSCs. Cells were stained with Oil Red O after 3 weeksin induction culture. The lipid globules of adipocytes were stained red. Scale bar, 50 µm. Osteogenesis of BM-MSCs, CB-MSCs, and PB-MSCs. Cells were stained with Von Kossa after osteogenic induction for 3 weeks. Calcium deposits of osteocytes were stained in brown. Scale bar, 50 µm. Chondrogenesis of BM-MSCs, CB-MSCs, and PB-MSCs. Cells were stained with Alcian Blue after chondrogenic induction for 3 weeks. Proteoglycans deposits of chondrocytes were stained blue. Scale bar, 25 µm. (B) Relative expression of adipogenic and osteogenic markers in BM-MSCs, CB-MSCs, and PB-MSCs before (d0, white bars) or after (d22, gray bars) induction of differentiation. Data (n = 3) are presented as the mean S.D., and asterisks indicate statistically significant values. The significance of differences was evaluated by independent samples Student's t-test (SAS version 8.0, Cary, NC, USA). *p<0.05, **p<0.01 and ***p<0.001.

