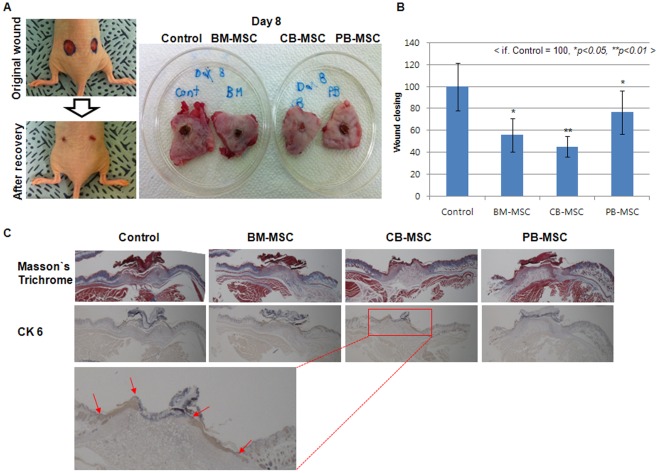
Figure 4. Comparison of the therapeutic effect of BM-, CB- and PB-MSCs on wound disease model mouse.
(A) Representative photographs of wounds after treatment with control vehicle medium (medium control), BM-MSC (3×10⁶ cells), CB-MSC (3×10⁶ cells) and PB-MSC (3×10⁶ cells) by subcutaneous injection around the wound site. (B) Measurement of wound closing at different days. Data (reach group: n = 6) are presented as the mean S.D., and asterisks indicate statistically significant values. The significance of differences was evaluated by Student's t-test (SAS version 8.0, Cary, NC, USA). *p<0.05, **p<0.01 (C) CK 6 staining of control medium, BM-MSC (3×10⁶ cells), CB-MSC (3×10⁶ cells) and PB-MSC (3×10⁶ cells) treatment groups on days 8. Red arrows mean CK-6 positive re-epithelilazed region in CB-MSC transplantation group.

