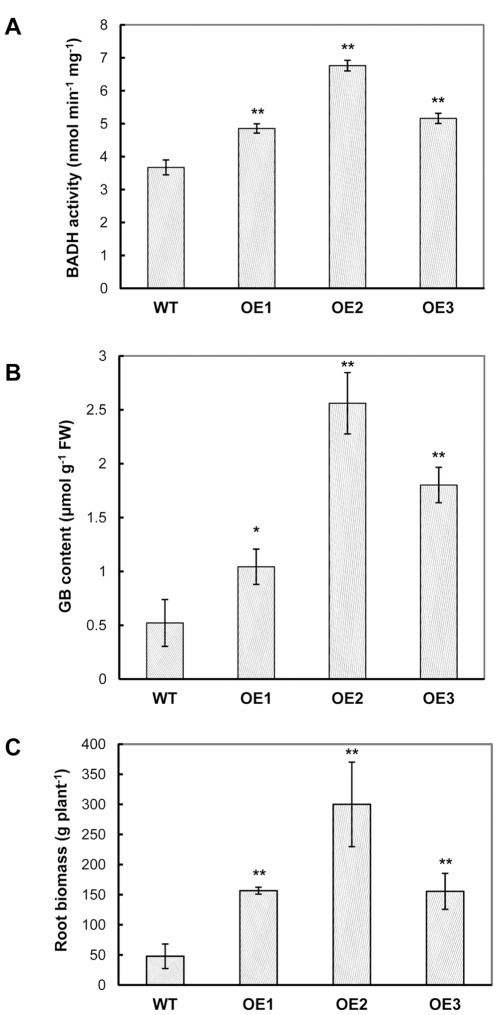
Figure 1. BADH accumulation and root biomass of wild-type and the SoBADH transgenic plants.
A and B show the BADH activity and GB content in the leaves, respectively; C shows the root biomass. OE1–OE3, SoBADH overexpressing transgenic lines; WT, wild-type plant. Values represent the mean ± SD (n = 9). Asterisks indicate a significant difference from that of WT at * P<0.05 or ** P<0.01 by t-test.

