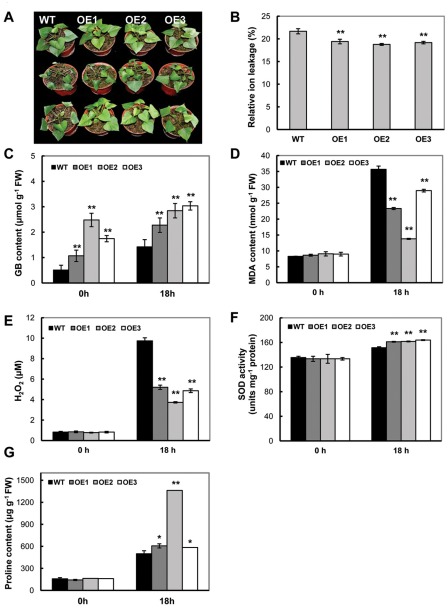
Figure 6. Phenotypic and physiological analyses of the SoBADH transgenic plants under cold treatment.
A, phenotypic changes before (upper panel) and after (middle panel) cold treatment (4°C for 18 h) and the recovered phenotype (lower panel); B, decreased ion leaking in the cold-treated leaf discs of OE plants than that of WT; C, contents of GB in the leaves of transgenic and WT plants after cold treatment; D–E, MDA and H2O2 contents in the leaves of the transgenic and WT plants; F, changes of SOD activity in transgenic and WT plants after cold treatment. G, proline contents in the leaves of the transgenic and WT plants after the treatment. Values represent the mean ± SD (n = 9). Asterisks indicate a significant difference from that of WT at * P<0.05 or ** P<0.01 by t-test.

