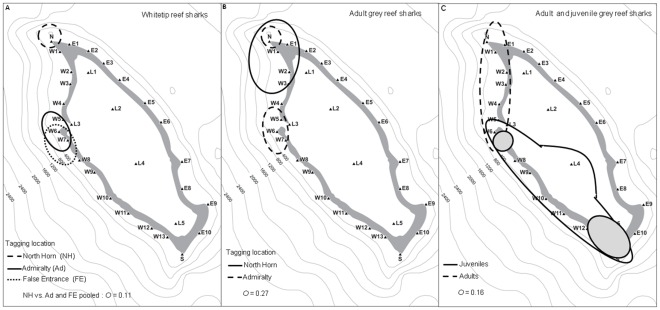
Figure 4. Area use maps, showing the 95% contours of the number of hours of detection occurred for sharks at different tagging locations and the comparison of spatial use with Pianka’s niche overlap value (O), where 0 represents no overlap and 1 equals total overlap.
Panel A - whitetip reef sharks tagged at three locations.Note that for the O value calculation, sharks tagged at Admiralty and False Entrance were pooled and compared with North Horn individuals. Panel B – Adult grey reef sharks tagged at two locations. Panel C – All adult grey reef sharks compared with juveniles. The grey shaded area represents the 80% contours of juvenile hourly detections.

