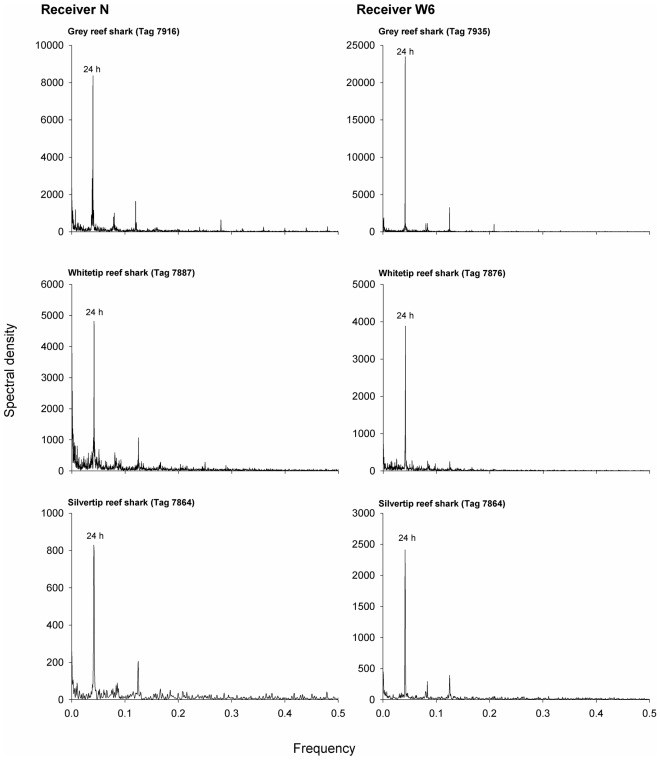
Figure 5. Fast Fourier transform of the time series of number of detections per hour for one representative individual of each species at receivers N and W6.
Periodicities of peaks are given over the peaks. Receivers N and W6 were chosen for this analysis because these correspond to the tagging areas, and most individuals spent a large part of their time in the vicinity of the tagging place throughout the study. Therefore, data from these receivers provides more complete information on the dial activity periodicity. FFT analysis for the other adult individuals of the three species that were regularly detected at these receivers throughout the course of the study led to similar results.

