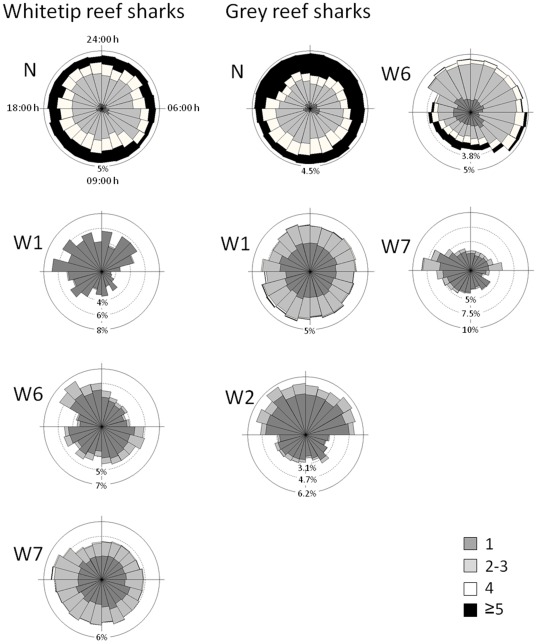
Figure 6. Circular plots showing the distribution of the number of individuals detected at each hour of the day for each of the main receivers (in % of total) for whitetip and grey reef sharks.
Note the differences in scale between plots. Different shadings represent the number of sharks detected in a given hour.

