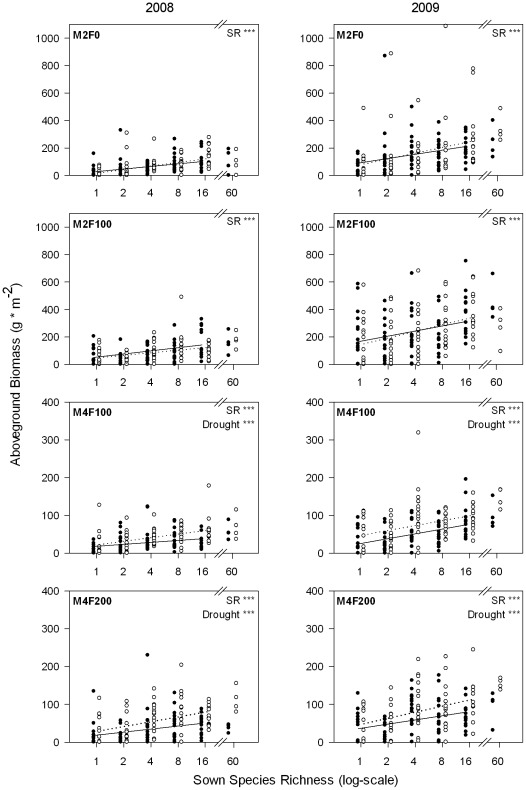
Figure 2. Aboveground biomass across sown species richness gradient for each management treatment.
Aboveground biomass at the end of the induced drought period in August 2008 (left column) and 2009 (right column) measured regrowth since the last cut (M2-types: June; M4-types: July). The ambient treatment is given in open circles (dotted regression line) and drought treatment in closed circles (solid regression line). Significant effects obtained from mixed models for every single management treatment per year: SR = effect of sown species richness (linear), drought = difference in drought and ambient treatments, * = p<0.05, ** = p<0.01, *** = p<0.001.

