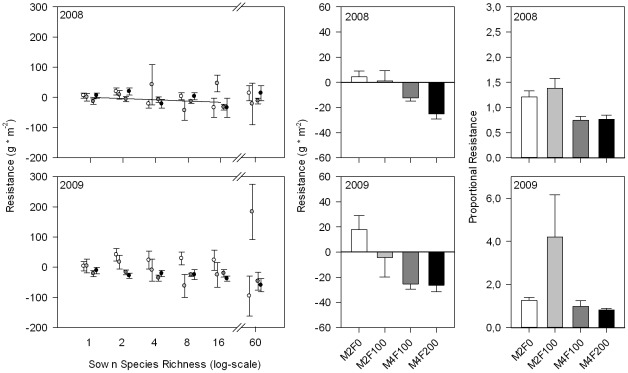
Figure 3. Resistance of biomass production for 2008 and 2009.
Resistance was calculated as the difference of drought and corresponding ambient treatments at the end of the drought period in August and was plotted against species richness (left) and management treatments (middle). Regression lines are given for significant effects of species richness. Proportional resistance (ratio of drought to ambient treatment) was plotted against management treatment (right). Management treatments are shown in white (M2F0), gray (M2F100), dark gray (M4F100) and black (M4F200).

