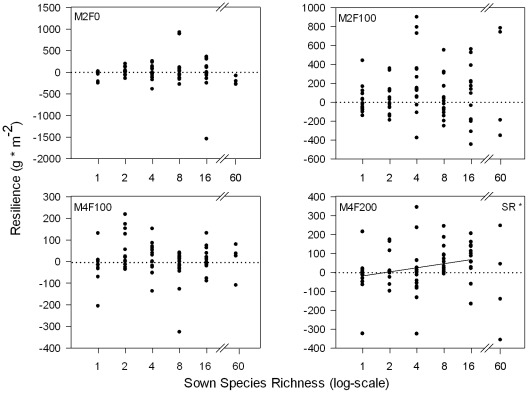
Figure 4. Resilience of biomass over sown species richness for each management treatment.
Resilience of biomass was calculated as the difference of drought and corresponding ambient treatments for the first harvest in spring 2009 (M2-types: June, M4-types: April). Regression lines are given for significant effects obtained from linear models for every single management treatment per year: SR = effect of sown species richness (linear), drought = difference in drought and ambient treatments, * = p<0.05, ** = p<0.01, *** = p<0.001.

