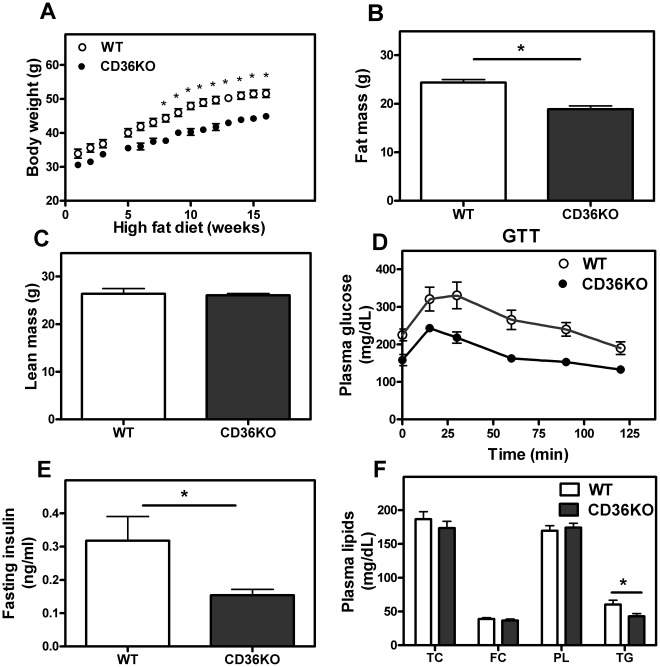
Figure 1. CD36 KO mice are resistant to high fat diet-induced obesity compared to WT mice.
A–C. WT and CD36 KO male mice were maintained on a HFD for 16 wks. Body weight was measured weekly. After 16 wks on HFD, lean body mass and fat body mass were determined by MRI. Plasma was collected after 6 h of fasting. D. Glucose tolerance test (GTT). Mice were given a bolus of D-glucose (2 g/kg body weight) i.p. after 6 h of fasting. E, F. Fasting (6 h) insulin levels were determined by ELISA kits (BD Bioscience) and plasma lipid levels were determined by commercially available kits (WAKO). Values shown are mean ± SD (n = 7 except GTT, n = 5). *, p<0.05, CD36 KO vs. WT.

