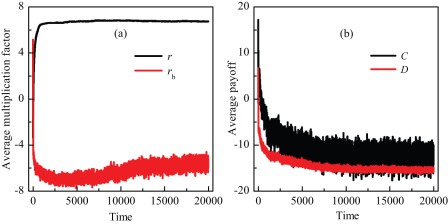
Figure 3. Time evolution of average multiplication factor and payoffs.
Panel (a) depicts the time evolution of average values of multiplication factor in the whole population and in the boundary groups, respectively. Panel (b) depicts the time evolution of average payoffs of cooperators and defectors along the boundary, respectively. It can be observed that although the average value of multiplication factor in the whole population is large enough for the evolution of cooperation [44], the average value along the boundary becomes negative. Correspondingly, the average payoffs of cooperators and defectors along the boundary are both less than zero. As time increases, the average payoff of cooperators along the boundary is a little higher than that of defectors, but has larger fluctuations. Here,  ,
,  , and
, and  .
.

