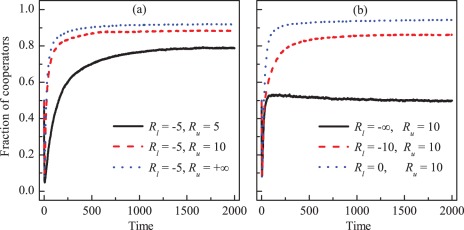
Figure 4. Cooperation promoted when the values of the lower and upper limits of the investment returns are increased.
Panel (a) depicts the fraction of cooperators in the whole population as a function of time for fixed lower limit  and different values of upper limit. Panel (b) depicts the fraction of cooperators in the whole population as a function of time for fixed upper limit
  and different values of lower limit. Increasing the values of lower and upper limit can provide more positive effects on the evolution of cooperation. Here,
  and
and  .
.

