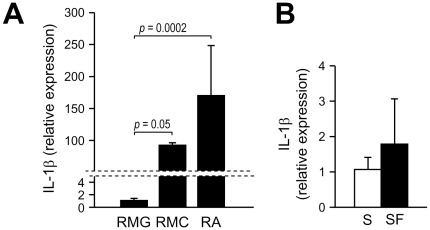
Figure 5. Differential expression of IL1R1 in rat microglial and macroglial cells.
(A) Rat microglia (RGM), Müller cells (RMC), and astrocytes (RA) were cultured in NG medium for 4 days. Total RNA was extracted and IL1R1 mRNA levels were assayed by quantitative RealTime RT-PCR. IL1R1 expression in Müller cells and astrocytes was calculated relative to the expression in microglia by the comparative ΔΔCT method using the mean ΔCT obtained in microglial cells as the calibrator. Bars represent mean ± SD of the results obtained from 2–3 isolates per cell type. RMG: n = 6, RMC: n = 2, RA: n = 6. (B) IL1R1 expression in microglia cultured in serum-free medium. RMG, cultured in normal medium (10% FBS) (S) until confluency, were switched to serum-free medium (SF) for 24 hours before harvesting. Cells cultured in basal medium for the duration of the experiment were used as control. The expression of IL1R1 was determined by RealTime RT-PCR. Bars represent mean ± SD of the results obtained in three different isolates tested in independent experiments. n = 5/group.

