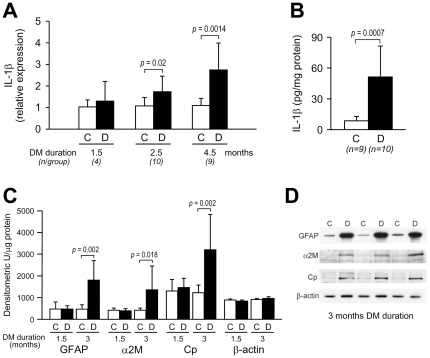
Figure 6. Effect of diabetes duration on the retinal expression of IL-1β and markers of glial reactivity.
All experiments were conducted in diabetic (D) and age-matched control (C) rats. (A) Time course of IL-1β upregulation in relation to diabetes duration. IL-1β mRNA levels in the retina were quantified by RealTime RT-PCR. Bars represent mean ± SD of the results obtained in the indicated number of rats at each time point tested. (B) Increased protein levels of IL-1β protein in the retina in diabetes. IL-1β protein was quantified by ELISA at 5 months of diabetes duration. Bars represent mean ± SD of the results obtained in the indicated number of rats. (C) Time course of GFAP, α2-macroglobulin (α2M), and ceruloplasmin (Cp) expression. Protein levels were quantified by western blot analysis of whole retina lysates. Data are expressed as densitometric units per µg of protein. Bars represent mean ± SD. n = 4 rats/group at 1.5 months and 9 rats/group at 3 months. (D) Representative Western blots of GFAP, α2M, and Cp at 3 months of diabetes duration. β-actin was used as control for gel loading.

