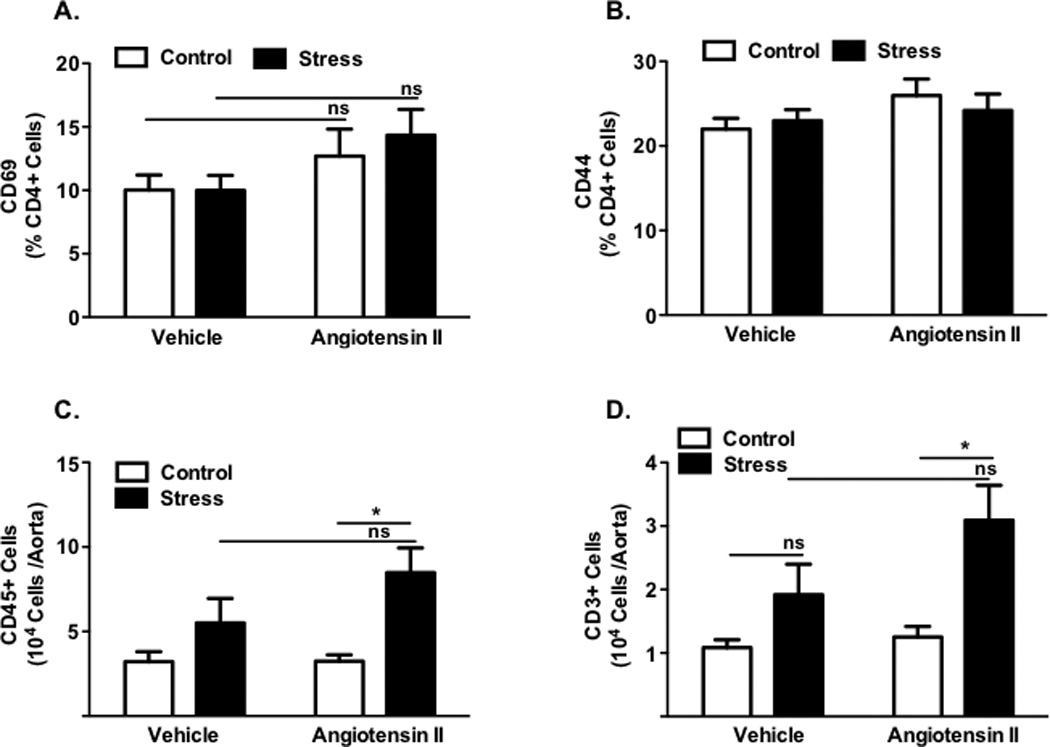
Figure 5. Effect of chronic stress on T cell activation and vascular infiltration following low-dose angiotensin II.

Percentage of circulating CD4+ lymphocytes expressing the early activation marker CD69 and tissue homing marker CD44 (Panels A–B) for stressed and control Ang II and vehicle mice (n=11–16). Total number of CD45+ leukocytes (Panel C) and CD3+ T cells (Panel D) in aortas of stressed and control Ang II and vehicle mice (n=10–13). (*P<0.01 Ang II vs Ang + Stress).
