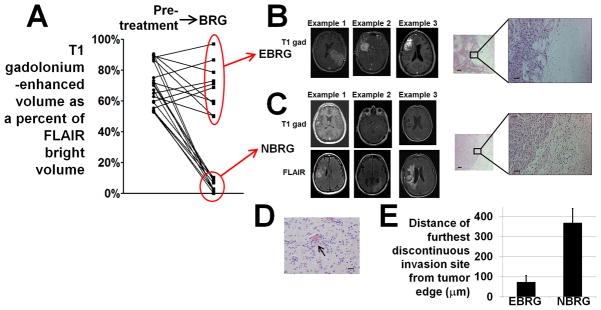
Figure 1. Two types of bevacizumab-resistant glioblastomas (BRGs).
(A) T1 gadolinium-enhanced volumes as percentages of FLAIR-bright volume in BRGs clustered into 2 groups – enhancing bevacizumab-resistant glioblastomas (EBRGs) had enhancing volumes that were 50–97% of their FLAIR-bright volume, while non-enhancing bevacizumab-resistant glioblastomas (NBRGs) had enhancing volumes that were 0–10% of their FLAIR-bright volumes. Optimal partitioning of tumors based on the percentage of FLAIR bright volume that enhanced (Supplementary Methods) was obtained by division into groups of 11 (high percentage of enhancement) and 10 cases (low percentage of enhancement). (B) T1-gadolinium enhanced axial images from 3 representative EBRGs are shown, with a hematoxylin and eosin staining of the brain-tumor interface to the right at low and high magnification. (C) T1-gadolinium enhanced (upper row) and FLAIR (lower row) axial images from 3 representative non-enhancing bevacizumab-resistant glioblastomas (NBRGs) are shown, with a hematoxylin and eosin staining of the less well defined brain-tumor interface to the right in low (50x, scale bar 200 μm) and high (200x, scale bar 50 μm) power. (D) Example of perivascular tumor invasion (arrow), seen in 2/5 NBRGs and 0/6 EBRGs with tissue from the brain-tumor interface available; 200x; scale bar, 20 μm. (E) mean distance of furthest discontinuous invasion site from the tumor edge was higher in NBRGs than EBRGs (P<0.001).

