
Figure 7.
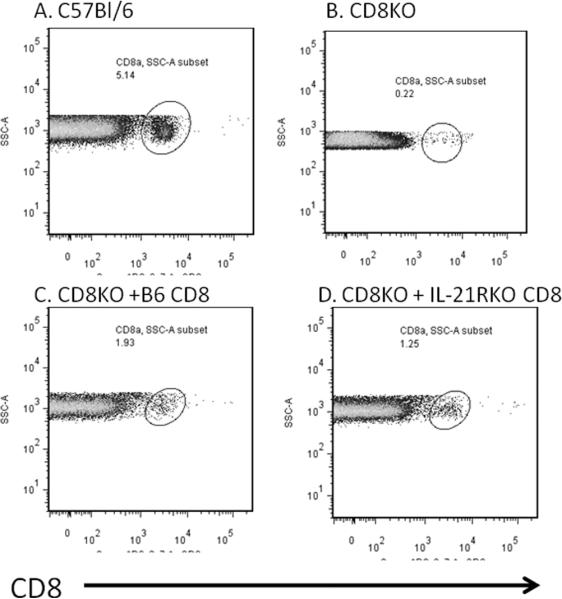
Flow diagrams of CD8+ cells. (A) C57Bl/6 or (B–D) CD8KO mice were infected with 100 PFU CVB3 and killed 7 days later. Spleens were evaluated by flow cytometry for CD8+ T cells. CD8KO mice were injected i.v. with either (B) PBS or 5 × 10⁷ purified CD8+ cells isolated from (C) C57Bl/6 or (D) IL-21RKO donor mice on the same day as CVB3 infection. Data show side scatter (SSC-A) versus cells labeling with anti-CD8 antibody. Circles indicate CD8+ T cells. Numbers indicate numbers of spleen lymphocytes positive for CD8.