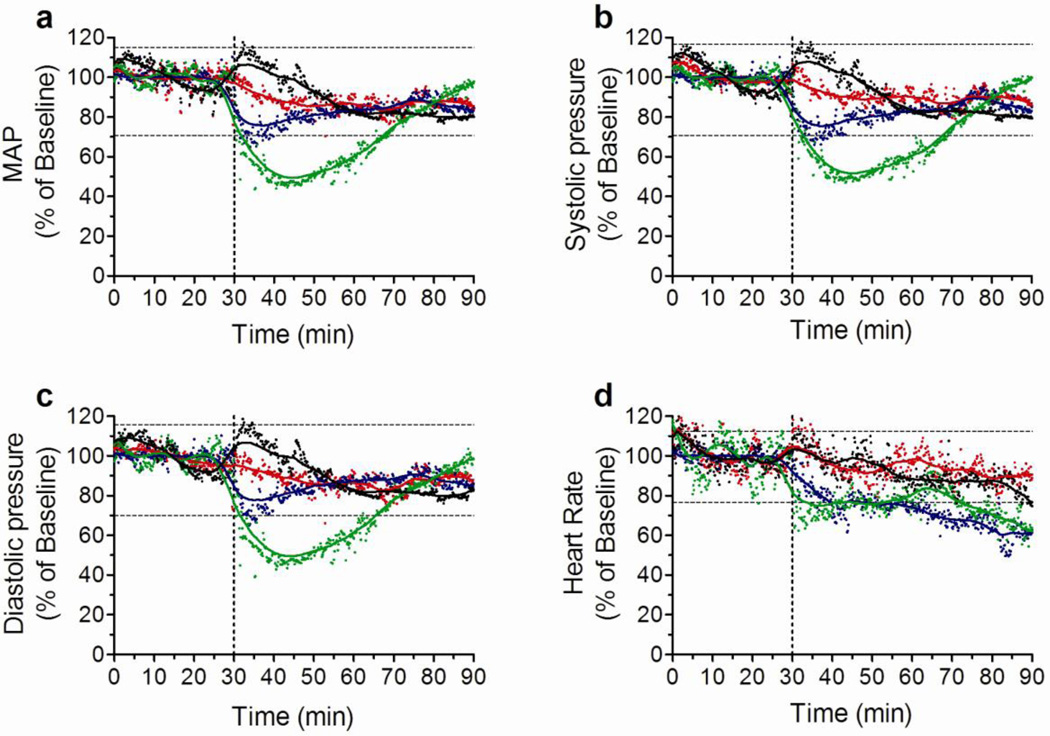
Figure 6. GSNO effects on cardiovascular parameters.
Changes in mean arterial pressure (MAP, A), systolic pressure (B), diastolic pressure (C), and heart rate (D) following one IP injection of saline (black dots and lines), and GSNO at 0.035 (red dots and lines), 0.35 (blue dots and lines), and 3.5 (green dots and lines). Vertical doted lines represent the time when the IP injection was given and separate the baseline period from the experimental period. Results are expressed as the percentage change in relation to the mean of the baseline period for each group. Horizontal doted lines represent the range of values falling within the mean plus and minus two standard deviations (SD) of the baseline value calculated for saline treated group. N = 4 per group.

