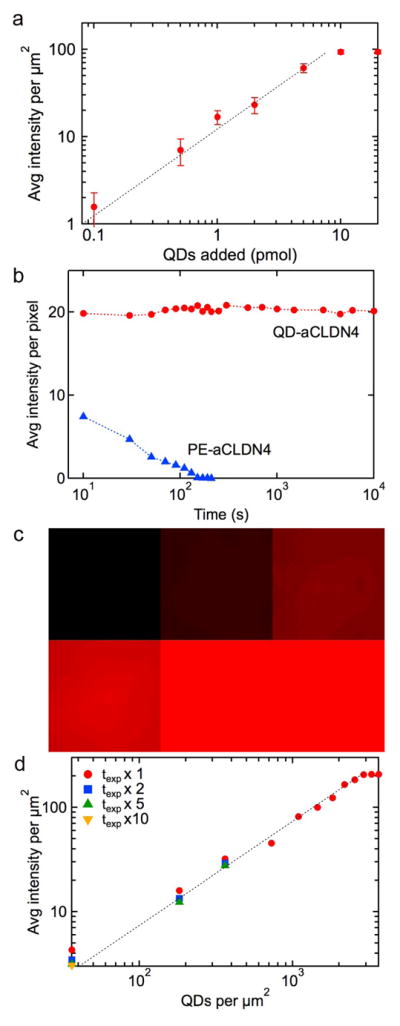
Figure 3.

Quantitative analysis of pancreatic cancer biomarkers from fluorescence images with QD-Ab conjugates. (a) Saturation of membrane biomarkers. Average fluorescence intensity for Panc-1 cells incubated with different concentrations of QD-aMSLN. The error bars represent the standard error for measurements over at least 30 cells. The slope at lower concentrations is 1.0 confirming negligible non-specific binding or competitive binding. The plateau at 10 mmol QDs indicates saturation of MSLN at the surface. (b) Stability of fluorescence in QDs and fluorophores. Average fluorescence intensity for Panc-1 cells incubated with QD-aCLDN4 conjugates or PE (phycoerythrin)-aCLDN4 conjugates versus illumination time.(c) Calibration of QD fluorescence. Fluorescence images for different concentrations of QDs confined between two glass slides with fixed area. Top row: 36, 360, 1087 QDs μm−2, bottom row: 1813, 2513, 2900 QDs μm−2. (d) Average fluorescence intensity (normalized for 0.5 s exposure time) versus QD concentration obtained from analysis of images of QD suspensions.
