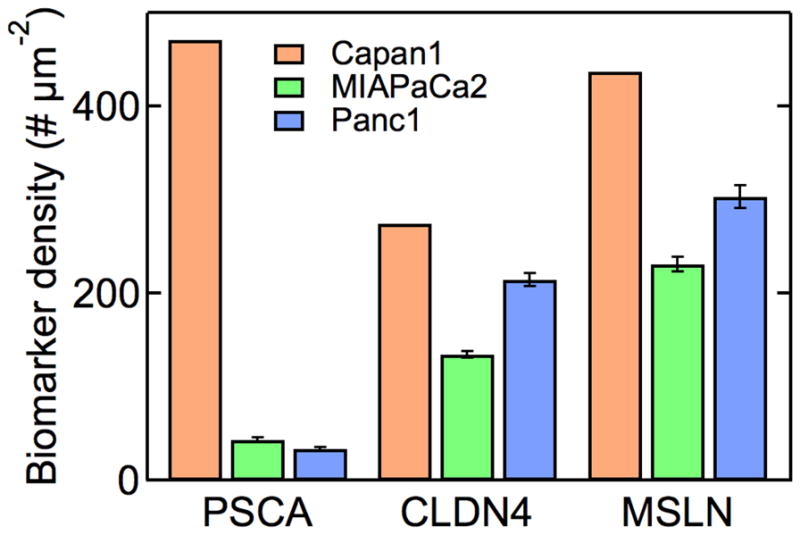
Figure 4.

Absolute expression levels for biomarkers for pancreatic cancer. Average biomarker density per μm2 for PSCA, claudin-4 and mesothelin in the three pancreatic cancer cell lines obtained from the average fluorescence intensity per cell and the calibration curve. Data were obtained from at least 300 Capan-1 cells, 100 MIAPaCa-2 cells, and 50 Panc-1 cells. Error bars represent the standard error. Data are tabulated in Table S1.
