Figure 6.
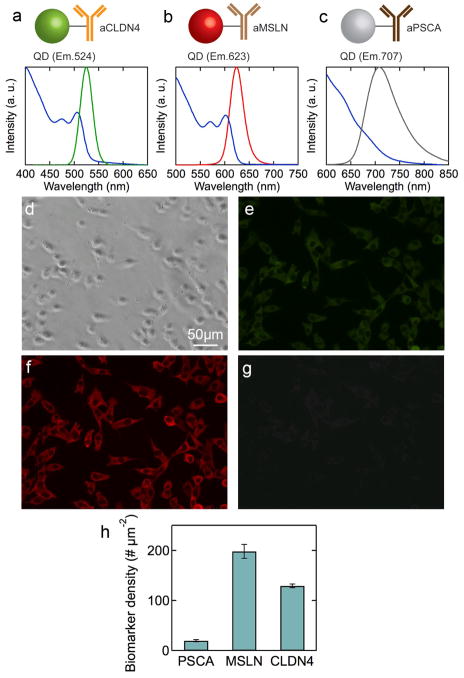
Multiplexed imaging of cancer biomarkers on MIAPaCa-2 cells. Absorbance and emission spectra for (a) QD(Em.524)-L-aCLDN4, (b) QD(Em.623)-L-aMSLN, and (c) QD(Em.707)-L-aPSCA. (d) Phase contrast microscope image for MIAPaCa-2 cells after incubation with the three QD-Ab conjugates. Fluorescence images obtained with (e) FTIC (517/40, green), (f) TRITC (605/40, red), and (g) NIR (665 LP, infra red) filters. (h) Average biomarker density per cell for PSCA, claudin-4 and mesothelin in MIAPaCa-2 cells measured simultaneously. Standard error obtained from 150 cells.

