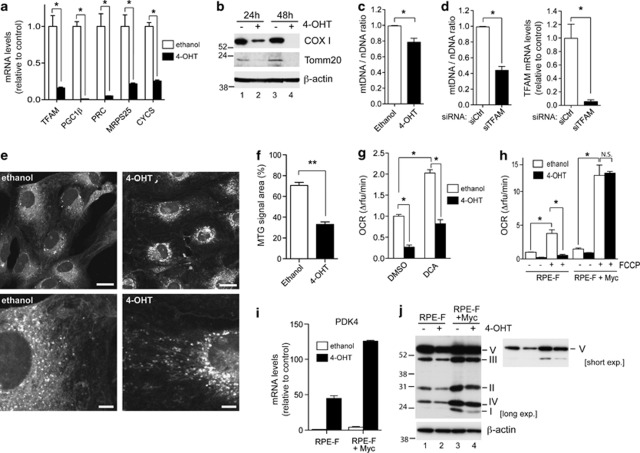
Figure 5.
Regulation of mitochondrial function by FOXO3a. (a) RPE.FOXO3a.A3.ER (RPE-F) cells were treated with solvent (white bars) or 100 nM 4-OHT (black bars) for 24 h. Expression of the indicated mitochondrial genes was determined by qRT-PCR. (b) RPE-F cells were treated with 4-OHT of solvent for 24 or 48 h. Expression levels of COX1 and Tomm20 were determined by immunoblotting. β-Actin is shown as a loading control. (c) Ratio of mtDNA to nuclear DNA (mtDNA/nDNA) was determined by qPCR using DNA from RPE-F cells treated with solvent (white bars) or 4-OHT (black bars) for 48 h. (d) RPE-F cells were transfected with 100 nM of either control (white bars) or a pool of siRNAs targeting TFAM (black bars) for 72 h. Ratio of mtDNA to nDNA was determined by qPCR. Silencing of TFAM was confirmed by qRT-PCR. (e) RPE-F cells were treated with ethanol or 4-OHT for 48 h, fixed in formaldehyde, stained using 100 nM MTG and visualised using confocal microscopy. Scale bar, upper panels 20 μm, lower panels 5 μm. (f) Quantification of area occupied by MTG stain. The area occupied by MTG in each cell was measured from confocal images using Metamorph software in 20 cells from two independent experiments. (g) Oxygen consumption was measured in RPE-F cells treated with solvent (white bars) or 4-OHT (black bars) for 48 h. In all, 50 mM DCA or solvent (DMSO) was added for the final 24 h before measurement. (h) OCRs were measured in RPE-F or RPE-F+c-Myc cells following 48 h of solvent (white bars) or 4-OHT (black bars). In all, 2 μM FCCP was added to determine mitochondrial capacity. (i) RPE-F or RPE-F+c-Myc cells were treated with solvent for 24 h (white bars) or 4-OHT (black bars). Expression of PDK4 was determined by qRT-PCR. (j) RPE-F or RPE-F+c-Myc cells were treated with solvent or 4-OHT for 48 h. Total cell lysates were used to detect OXPHOS complexes by immunoblotting. β-Actin is shown as a loading control. All data are shown as mean±S.E.M. The symbol ‘*' indicates statistical significance, as determined by Student's t-test (P<0.05, n=3). The symbol ‘**' indicates statistical significance, as determined by Student's t-test (P=1 × 10⁻⁸, n=20). NS, nonsignificant

