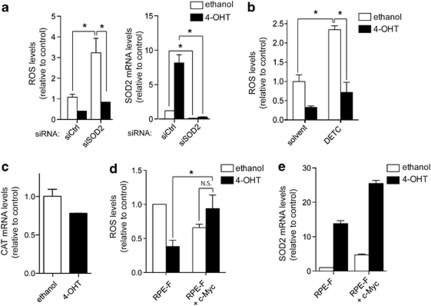
Figure 6.
FOXO3a-dependent reduction in ROS is independent of SOD2 and is rescued by re-expression of c-Myc. (a) RPE-F cells were transfected with 100 nM of either controls (siCtrl) or siRNAs targeting SOD2 (siSOD2) for 72 h and treated with 4-OHT or solvent for the final 48 h. ROS levels were determined by measuring fluorescence of CM-H2DCFDA by flow cytometry. Expression levels of SOD2 were determined by qRT-PCR. (b) RPE-F cells were treated with 4-OHT or solvent for 48 h before treatment with 15 mM of the SOD2 inhibitor DETC for 90 min. ROS levels were determined by measuring fluorescence of CM-H2DCFDA by flow cytometry. (c) RPE-F cells were induced with 4-OHT or solvent for 24 h. Expression of CAT was determined by qRT-PCR. Data shown are representative of three independent experiments. (d) RPE-F or RPE-F+c-Myc cells were treated with 4-OHT or solvent for 48 h. ROS levels were determined by measuring fluorescence of CM-H2DCFDA by flow cytometry. (e) Expression levels of SOD2 mRNA in RPE-F and RPE-F+c-Myc cells treated with 4-OHT or solvent for 48 h were determined by qRT-PCR. Data shown are representative of three independent experiments. All data are shown as mean±S.E.M. The symbol ‘*' indicates statistical significance, as determined by Student's t-test (P<0.05, n=3). NS, nonsignificant

