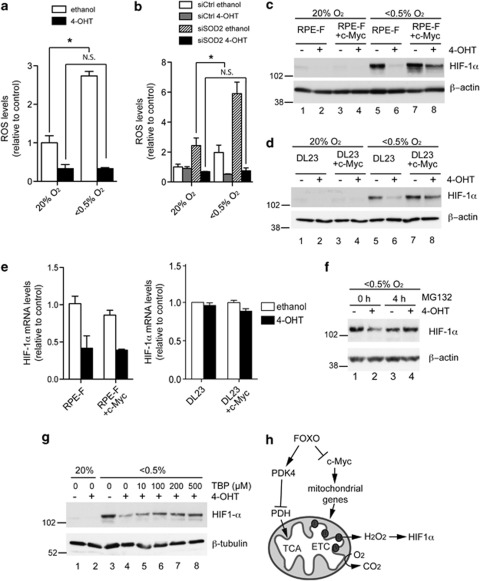
Figure 8.
FOXO3a activation prevents ROS induction in hypoxia independent of SOD2 induction and blocks HIF-1α stabilisation. (a) RPE-F cells were pretreated with solvent (white bars) or 4-OHT (black bars) for 6 h and placed in normoxic (20% O2) or hypoxic (<0.5% O2) conditions for a further 48 h. ROS levels were determined by measuring fluorescence of CM-H2DCFDA by flow cytometry. (b) RPE-F cells were transfected with 100 nM of either control (siCtrl) or siRNAs targeting SOD2 (siSOD2) before being treated with 4-OHT or solvent in either normoxic or hypoxic conditions for 48 h. ROS levels were determined by measuring fluorescence of CM-H2DCFDA by flow cytometry. (c) RPE-F or RPE-F+Myc cells were treated with 4-OHT or solvent for 24 h and then placed in normoxic or hypoxic conditions for a further 24 h. Expression of HIF-1α was determined by immunoblotting. β-Actin is shown as a loading control. (d) DL23 or DL23+c-Myc cells were treated and analysed as in c. (e) RPE-F and RPE-F+c-Myc and DL23 and DL23-c-Myc cells were treated with 4-OHT or solvent for 24 h. HIF-1α mRNA levels were determined by qRT-PCR. Data shown are representative of three independent experiments. (f) DL23 cells were treated with 4-OHT or solvent for 24 h and placed in hypoxic conditions for a further 24 h. In all, 25 μM MG132 was added for the final 4 h. Expression of HIF-1α was determined by immunoblotting. β-Actin is shown as a loading control. (g) DL23 cells were treated with 4-OHT or solvent for 24 h and then placed in normoxic or hypoxic conditions for a further 24 h. Boluses of TBP were applied at the indicated concentrations every 20 min for the final 2 h. Expression of HIF-1α was determined by immunoblotting. β-Tubulin is shown as a loading control. (h) Diagram of FOXO action on mitochondrial activity. Induction of PDK4 by FOXO3a reduces TCA cycle activity and respiration. Inhibition of c-Myc function by FOXO3a lowers mitochondrial gene expression, reduces the formation of ROS and blocks stabilisation of HIF-1α. (ETC, electron transport chain). All data are shown as mean±S.E.M. The symbol ‘*' indicates statistical significance, as determined by Student's t-test (P<0.05, n=3). NS, nonsignificant

