Figure 2.
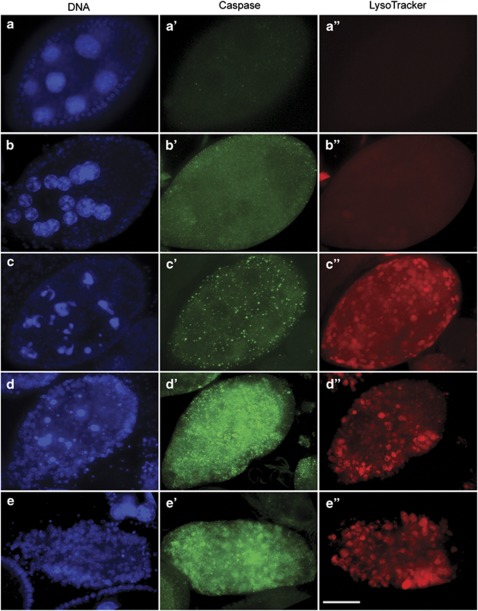
WT progression of starvation-induced PCD at mid oogenesis. All egg chambers were stained with DAPI (blue) to label DNA, anti-cleaved caspase-3 (green) and LT (red) to label lysosomes. (a–a″) A healthy egg chamber from a well-fed fly. (b–e″) Egg chambers from starved flies in the process of degeneration. (b–e) In degenerating egg chambers, NC nuclei become condensed and fragment into smaller pieces that are engulfed by the surrounding FCs. (a′–e′) As the NC nuclei fragment, caspase activity increases. (a″–e″) LT positive spots increase, indicating an increase in lysosomes and/or autolysosomes. All egg chambers are at stage 8. All images were taken at the same magnification and are projections of 15–25 images. Scale bar is 15 μm

