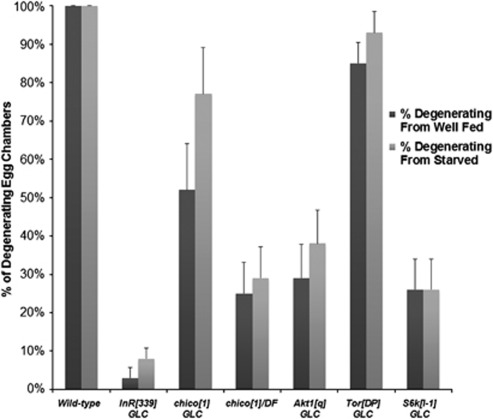
Figure 7.
Quantification of starved insulin signaling pathway mutant ovary phenotypes. Insulin mutants were deprived of amino acids similar to WT starved flies. Bar graphs shows the percentage of degenerating egg chambers compared with Pwops in well-fed versus starved flies. WT, InR339 GLC, chico1/Df, Aktq GLC, TorΔP GLC, and S6kl−1 GLC comparison of well fed versus starved had a P-value >0.05 indicating there was no significant difference, whereas chico1 GLCs had a P-value <0.05. (WT P-value=1, InR339 GLCs P-value=0.064, chico1 GLCs P-value=0.039, chico1/Df P-value=0.6234, Aktq GLCs P-value=0.308, TorΔP GLCs P-value=0.1471, and S6kl−1 GLCs P-value=1). The total numbers of egg chambers (degenerating+Pwop) for starved flies were: 54 (WT), 192 (InR339 GLCs), 61 (Aktq GLCs), 47 (chico1 GLCs), 49 (chico1 /Df), 55 (TorΔP GLCs), 46 (S6kl−1 GLCs). Data for the well-fed flies were the same as in Figure 1 or Supplementary Figure 1. Error bars represent S.E. calculated using a standard two-tailed t-test

