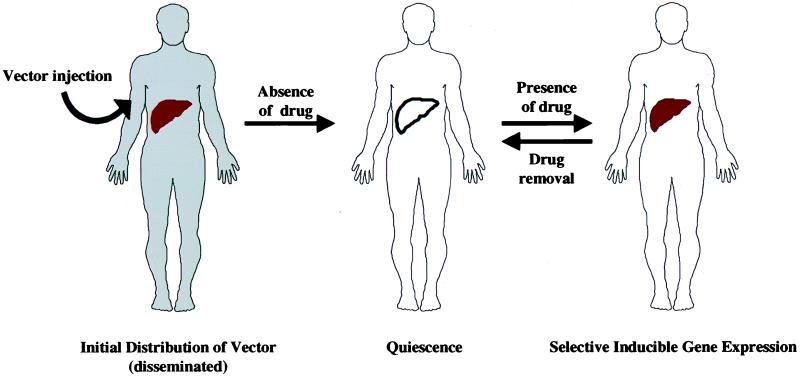
Figure 2.
Model of selective and inducible gene expression with ligand-regulated adenoviral vector. Gray area (Left) shows initial distribution of vector after intravenous injection. In the absence of drug treatment, vector gene expression remains minimal (Center). It is markedly increased, primarily in the liver, in a reversible fashion after drug administration (Right).

