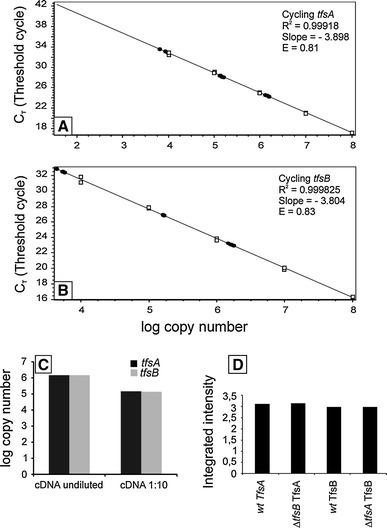
Fig. 2.

Standard curves for the quantification of a tfsA and b tfsB gene transcription in T. forsythia wt cells. Standard values (open boxes) were obtained by amplifying the tfsA or tfsB genes using different dilutions of the tfsAB operon (purified and quantified PCR product used as template) in ascending order. Black circles indicate calculated CT values for analyzed samples. c Absolute quantification of tfsA/tfsB gene transcription in T. forsythia wt cells. Undiluted and 10-fold diluted cDNA was used as template and consistent absolute transcription levels (copy numbers) were determined for both genes. d Relative protein expression levels of TfsA/TfsB in T. forsythia wild-type cells and respective mutant strains. 0.7 mg of total crude cell extract applied to each lane in SDS-PAGE
