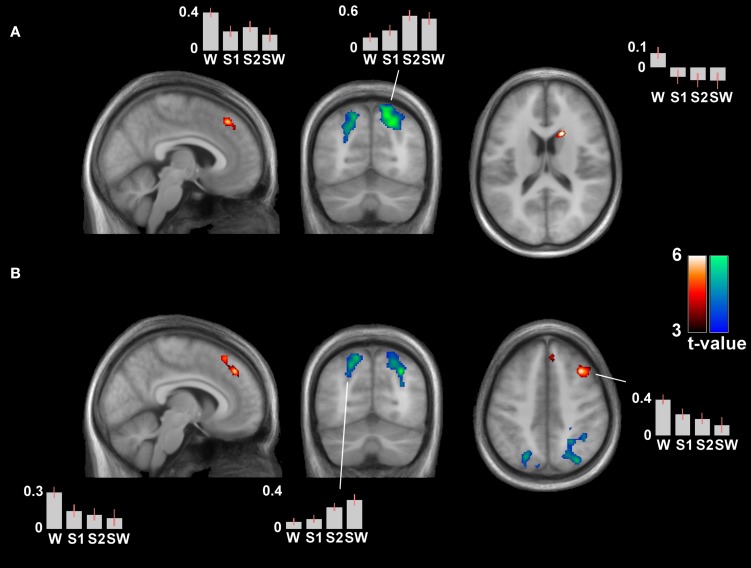
Figure 4.
Differential contrasts (wakefulness versus sleep) of the connectivity patterns of the time-course of the left (A) and right inferior parietal lobule (B). Wakefulness > sleep is represented by hot colors, the reverse contrast by cool colors. Depicted clusters have whole-brain corrected significance: the superior medial frontal gyrus and right caudate in (A), and the superior medial frontal gyrus and right middle frontal gyrus in (B). The right middle frontal gyrus was also noted in (A) at an uncorrected threshold (pcorr = 0.141). There was a generally increased (local) connectivity with neighboring parietal clusters in sleep. Contrast estimates are provided of peak voxels of significant clusters (for coordinates, see Table 2). MNI coordinates of slices in (A) [x y z] = [5 −67 17], and in (B) [7 −68 45].

